Infrastructure Monitoring with InfluxDB | Live Demonstration
Time Series Plot
Learn about time series plots: their working, types, and different use cases. Also, check how you can implement them in Python language.
Time series data are measurements collected at regular intervals over some period of time. A time series tracks how a variable changes across time. For example, if some amount of money were invested in the stock market, a time series depicts the trend pattern for a certain period to show how the stock’s value appreciates over time. The time series plot presents a visual representation of temporal data, showing how data values change over time. They help people understand trends and patterns in data.
What is a time series plot?
A time series graphically presents sequential data collected over time. In a time series plot, the x-axis represents time, and the y-axis represents a numerical variable of interest. Many fields, including economics, finance, engineering, and meteorology, utilize time series plots to actively visualize and analyze changes in data over time.
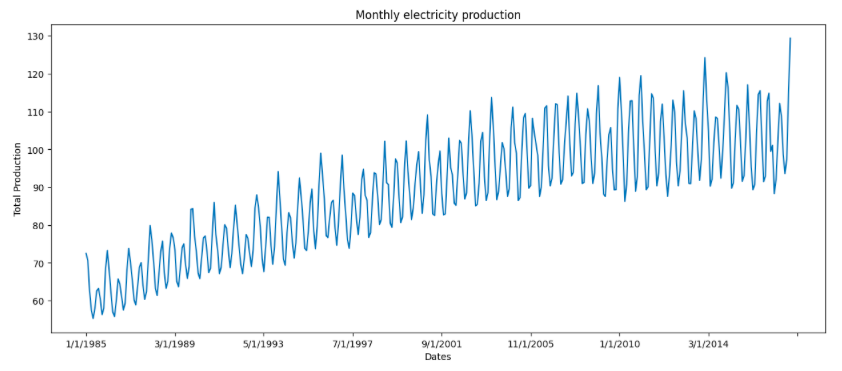
One use might be to investigate whether the call volume in a call center remains relatively constant or if it exhibits specific trends, such as decline or growth from one month to the next. In that sense, a time series plot presents visual cues for the assessment of process stability. For example, the sample time series plot below shows the IP index of electricity production in the US using data from 1985 to 2015.
How does a time series plot work?
In the sample time series plot shown above, the x-axis represents the time in years. The y-axis represents the IP index of electricity production in the US. The line connecting the data points shows the overall trend of the data. The graph clearly explains that the electricity demand over the years has increased significantly.
A time series plot shows trends, patterns, and seasonality in data. It helps us to understand how the data changes over time, and to identify any potential problems or opportunities in a system.
Some types of information gained from a time series plot include:
-
Trends: Do the data values increase, decrease, or stay the same over time?
-
Seasonality: Do the data show any predictable patterns, such as higher temperatures in the summer and lower temperatures in the winter?
-
Data Outliers: Are any data points significantly different from the rest of the data?
-
Distribution: Do data points show an even distribution or do they cluster around certain values?
Thus, the information in time series plots can provide a better understanding of the underlying processes that generate the data. This helps to identify potential problems in any time-dependent system and helps make predictions about the future.
Types of time series plots
Line Plot
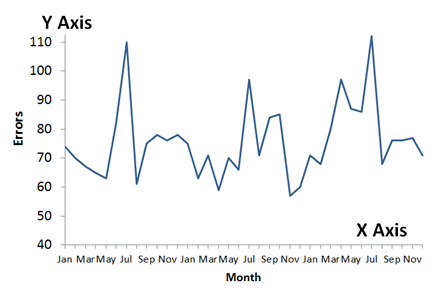
A line plot simply uses lines to connect data points across time. It’s the simplest type of time series plot. The data represented in line plots can have an uptrend (an increasing trend), a downtrend (a decreasing trend), or a horizontal trend (a value that holds steady over time). A simple line plot for the errors produced on a monthly basis by a shoe production machine might look like this.
Bar Plot
A bar plot uses bars to show categorical data. In bar plots, the length of the bar can represent the value of a category of data relative to one or more other categories. In this case, if the x-axis represents time, the y-axis represents the value for a category of data at a given time point. For example, the bar plot below shows how many interactions (called sessions) with a website occurred via different channels during specific time periods.
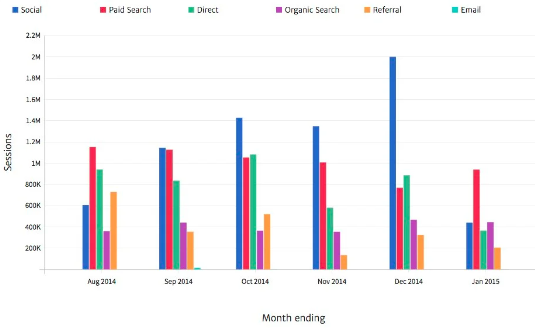
As you can observe, in October, November, and December most of the users visited the website through social channels.
Candlestick Chart
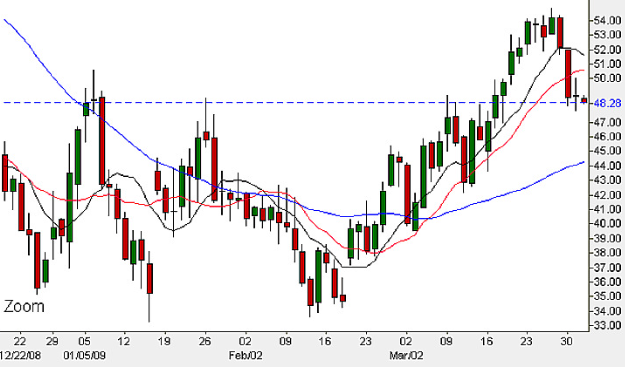
A candlestick plot might be used to show the opening, closing, highest, and lowest prices of a security over a period of time. Financial data analysts utilize candlestick charts. A simple representation of a stock value using the candlestick chart looks like this:
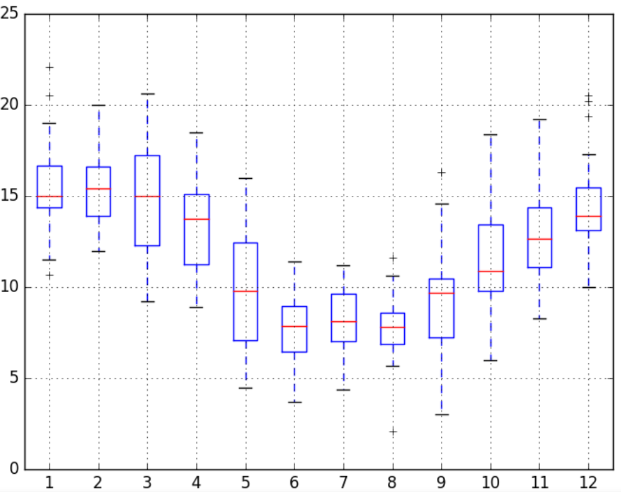
Box Plot
Box plots have bars that show the distribution of data points, along with lines that represent the minimum and maximum, median, quartiles, and outliers for a variable. They’re often used to compare the distributions of two or more variables.
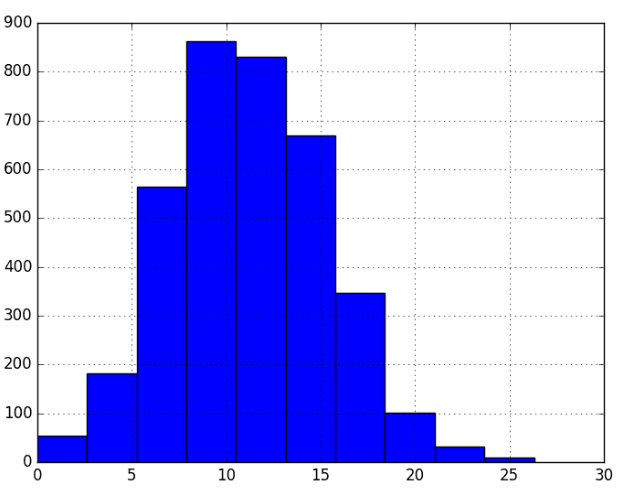
Histogram
Histograms are similar to bar charts, but they show quantitative data. They show the frequency of numerical measurements to help identify the shape of a distribution, such as whether a distribution is normal or skewed.
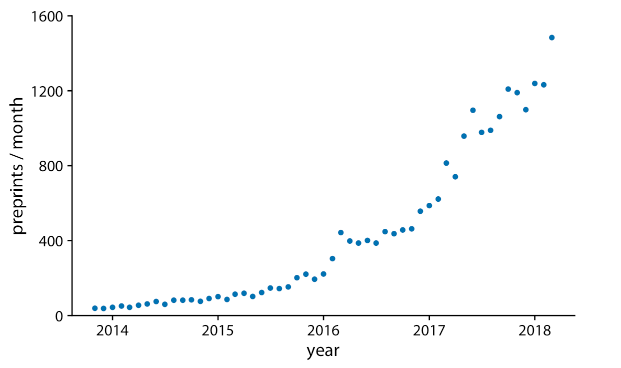
Scatter Plot
Scatterplots can show the relationship, or correlation, between two continuous variables in cross-sectional temporal data. A subtype of scatter plot called a lag plot is generally used for time series analysis. A simple lag plot for how many preprints of chemistry journal articles were requested over the years might look like this:
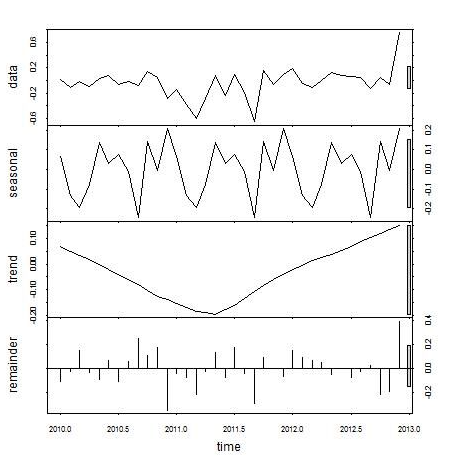
Seasonal Plot
Seasonal plots, also known as seasonal decomposition plots, show seasonal variations in data. They identify trends and patterns that repeat over time, demonstrating seasonal effects in time series data. They help identify any unusual behavior or fluctuation in time series data that might not be apparent in a regular time series plot. This plot usually has four components. The first component shows the data for the time series. The second shows the repeating patterns that represent the seasonal component. Third is the underlying trend component. And finally, the fourth component, called the remainder component, shows variation in the data not captured by the trend and season components.
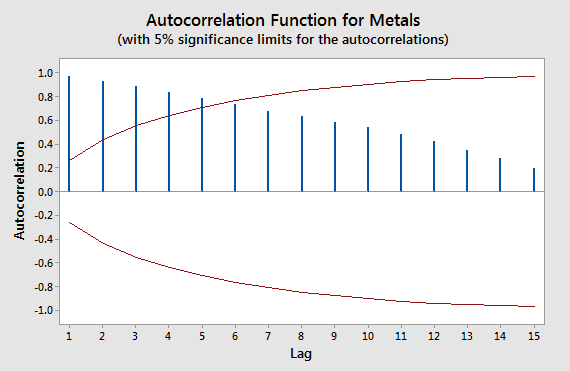
Autocorrelation Plot
Autocorrelation plots show the correlation between data points and their lagged values. A lagged value is simply a shift of the time series values from one or more time stamps. Autocorrelation plots are often used to identify trends and patterns related to the past. That is, they aim to reveal the inherent correlations between a data point and its own earlier value at various time lags, in contrast to traditional plots that explore associations between variables across multiple data points.
The best type of time series plot to use depends on the data and the goal of the analysis. For example, if you want to show the overall trend of the data, a line plot is a good choice. If you want to show the distribution of the data, a histogram or box plot is a better choice.
Why are time series plots used?
The best type of time series plot to use depends on the type of data represented and the goal of analyzing the data. For example, if you want to show an overall trend in the data, a line plot is a good choice. If you want to show the distribution of the data, a histogram or box plot is a better choice
Finance
Investors and financial analysts employ time series plots to monitor the performance of stocks, bonds, and other financial instruments. The plots identify patterns in the financial markets to help predict peaks and declines to generate profits and identify investment opportunities for clients.
Manufacturing
Time series plots can help track the output of factories to examine their daily production to improve efficiency. They can also track raw material consumption, quantity transported, and other useful metrics.
Retail
Another popular use case of time series plots is to track sales data to identify sales patterns and consumer behavior over a period of time. For example, a retailer can track the sale of a particular product to find seasonal trends and plan advertisements accordingly.
Retailers might also compare time series, such as the sales of different products over time. This aids in comparing trends in the market for different types of products. For example, comparing time series plots for the sales of different brands of cars can show that one brand consistently outsells the others during specific months, or changes over the years in which brand sells better.
Healthcare
Time series plots can track patient data, such as vital signs and medication usage. Additionally, healthcare professionals leverage these plots to detect trends and patterns in the spread of diseases over time.
Logistics
Logistics businesses use time series plots to track the movement of goods and materials to understand when and where downtime occurs so they can improve supply chain logistics, like delivery times and product distribution to local vendors.
Compare different time series
Time series plots can help compare different time series, such as the sales of different products over time. This can be helpful for understanding the performance of different products or for identifying trends in the market. For example, a time series plot of the sales of different brands of cars can show that one brand is consistently outselling the others.
How to create time series plots
There are different ways to create time series plots using languages like Python, and R Python packages like Pandas, Matplotlib, Seaborn, and Plotly can read data and create different types of time series plots. The code below creates a list of dates and a list of temperatures. Then, it creates a DataFrame using the time and temperature columns with the help of the Pandas library of Python. Finally, it saves the DataFrame to a CSV file called data.csv using the to_csv() method from Pandas.
# import dependency
import pandas as pd

# create a list of dates
dates = pd.to_datetime(['2023-03-08', '2023-03-09', '2023-03-10', '2023-03-11', '2023-03-12', '2023-03-13', '2023-03-14', '2023-03-15', '2023-03-16', '2023-03-17'])

# create a list of temperatures
temperatures = [10, 12, 15, 18, 21, 24, 27, 30, 33, 36]

# create a DataFrame
data = pd.DataFrame({'time': dates, 'temperature': temperatures})

# save the DataFrame to a CSV file
data.to_csv('data.csv', index=False)
The following are the most common libraries for creating time series plots in Python.
-
Matplotlib library: Matplotlib is a popular Python library for creating graphs and charts. It can create a variety of time series plots, including line plots, bar plots, candlestick charts, etc.
-
Seaborn library: Seaborn is a Python library that provides a high-level interface for creating statistical graphics. It can create time series plots with a variety of customized options.
-
Plotly library: Plotly is a Python library that provides interactive visualizations. It can create time series plots to embed in web pages or dashboards.
Here is an example of how to create a time series plot using the Matplotlib library:
# import dependencies
import matplotlib.pyplot as plt
import pandas as pd

# load the data
data = pd.read_csv('data.csv')

# extract the time and temperature columns
time = data['time']
temperature = data['temperature']

# plot the time series
plt.plot(time, temperature)

# add labels and title
plt.xlabel('Time (hours)')
plt.ylabel('Temperature (degrees Celsius)')
plt.title('Temperature over Time')

# show the plot
plt.show()
This code reads the data using the read_csv() method from the Pandas library. Then it creates a simple line plot using the plot() method from Matplotlib. Functions like xlabel() and ylabel() enhance the readability of the charts.
FAQs
What is the best type of plot for a time series?
There is no one-size-fits-all answer to this question. The best plot for a time series depends on the specific data and the goals of an analysis. However, some common plots used for time series data include seasonal plots, line plots, bar plots, and candlestick charts.
What is a time series plot in the Six Sigma methodology?
Time series plot in Six Sigma is not a specific plot type. Instead “time series plot” and “Six Sigma” are two separate concepts often used together in quality management and process improvement. In Six Sigma, a time series plot is a graphical representation of data collected over time for use in the define, measure, analyze, improve, and control (DMAIC) phases of Six Sigma. It identifies trends, patterns, and outliers in the data with the goal of improving the quality and consistency of a process.
Take charge of your operations and lower storage costs by 90%
Get Started for Free Run a Proof of ConceptNo credit card required.

Related resources

Free InfluxDB Training
Jump start your InfluxDB journey with free self-paced & instructor-led training.
